![]()
|
|
|
If you would like to see the filter that you have created on the generated report, you must enable the Show Filters in Report field in the Filters page of the Template Wizard.
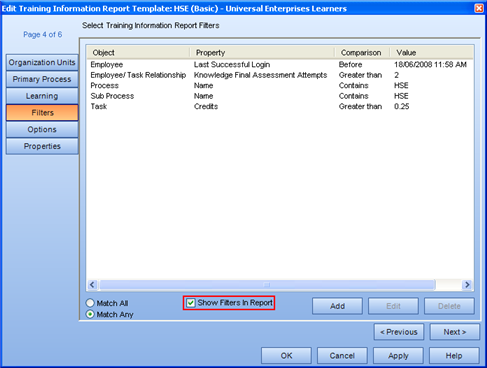
Having this information appear in the generated report is especially useful after exporting and saving the report to another location. This way, the filters that you used to generate the report are clear and are not lost.
In the case of the grid reports (Requalification and Task Completion) that are generated directly to Microsoft Excel, the filters used in a report function slightly differently than in the reports that are generated using Crystal Reports. These differences include:
How the Show Filters in Report is displayed
What the filter actually does
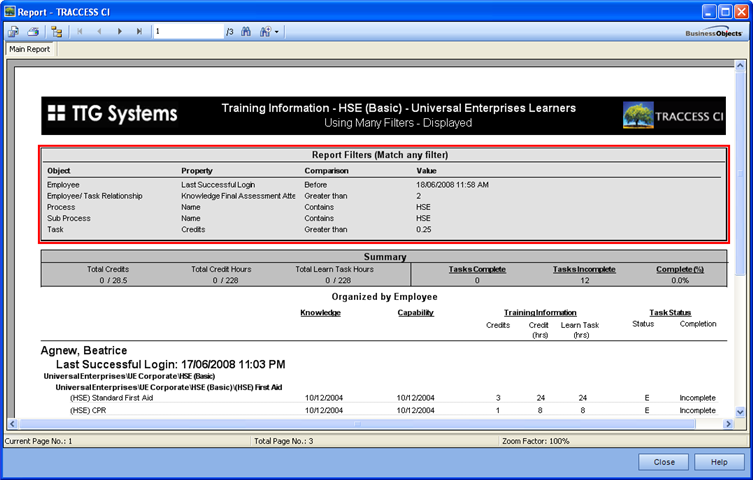
In the following example, the Qualification (Compact) and the Task Completion Reports are compared using the same filter. The selections are:
4 Learners have been selected: Beatrice Agnew, Eugene Campbell, Victor Dishman, and Malika Zimmerman. Malika was just recently hired, and therefore has no qualifications in the system.
The Process selected is HSE (Complete)
The filter created is Knowledge Qualification Date Exists. In this case, Malika should not have any previous qualifications, since she was just entered into the system.
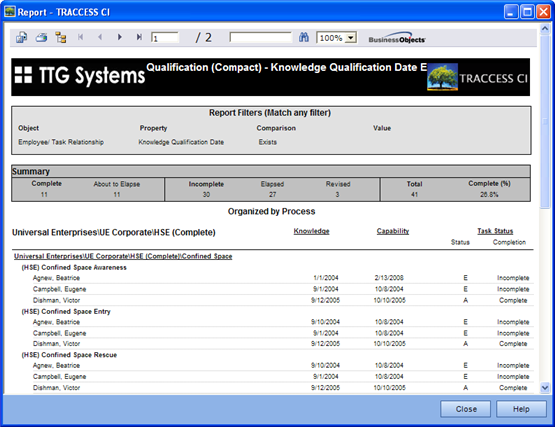
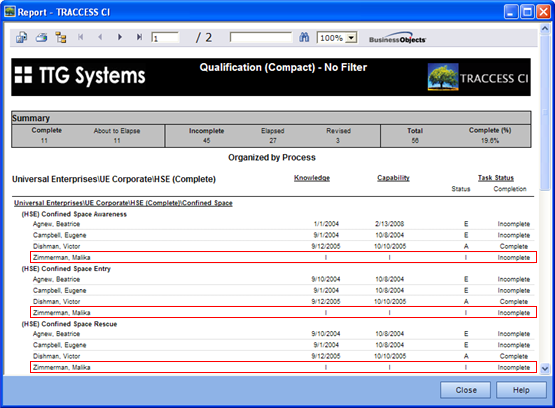
In the Qualification (Compact) Report, Malika's name does not show up at all, and the filter used (Knowledge Qualification Date Exists) is displayed at the top of the report.
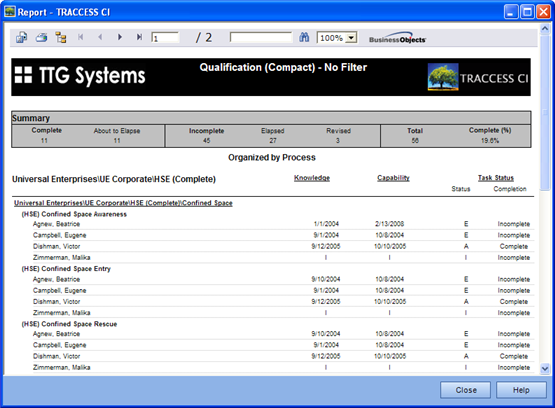
When the filter is removed, it shows that Malika does exist in the group, but is incomplete (with no previous dates of completion).
When the same selections are made in the Task Completion Report, a slightly different format is generated.
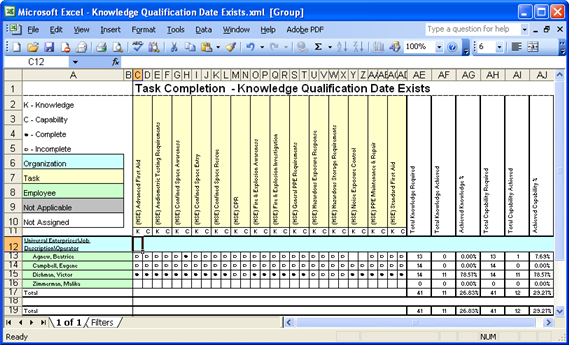
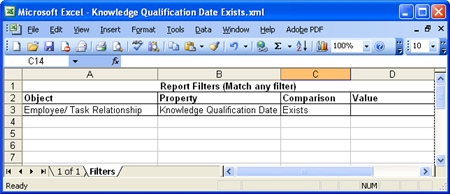
Malika's name does appear on this report, but the filters do not appear at the top of the report. They can be seen by clicking on the Filters Worksheet at the bottom of the spreadsheet.
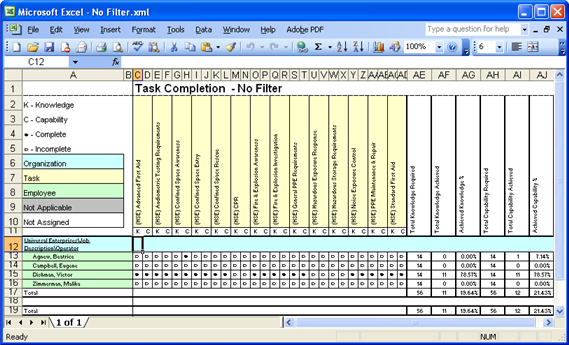
When the filter is removed, the spreadsheet no longer contains a Filters worksheet, and there is information next to Malika's name.
What is the reason for these differences in where the filter is displayed and what information is displayed? The answer to both of these questions is the format of the generated report forced these differences.
The cells could not be easily pushed down in the Excel spreadsheet to include the Filter Display, and they were therefore moved to another worksheet.
The appearance of different details is slightly more complex. In the Qualification (Compact) Report, almost each object has its own line. For example, if you were to create a filter that affected entire Organization Units, Employees, Processes, Sub Processes or Tasks, if that filter did not apply, the entire line would be removed. In the case of the above example, the report removes any information that does not fit with the filter, so when it comes to displaying the information, Malika's information is not there to be displayed.
However, in the case of Task Completion Report, a single horizontal line shares information with several objects - all of the Employee's Tasks (which include Process, Sub Process, Task, Knowledge and Capability). The list of people is automatically set in the grid, and the filter removes the information (qualification statuses) that do not satisfy the filter. Since Malika's name is already there, along with the Task Names, the report has no information to fill in the appropriate blanks. The Not Applicable field in this report applies to a Task that does not have a Knowledge or a Capability component, but did not accommodate for a filter that removed the information. Therefore, in this case, Malika's name appears, but the fields remain blank.

|
|
|
|