|
|
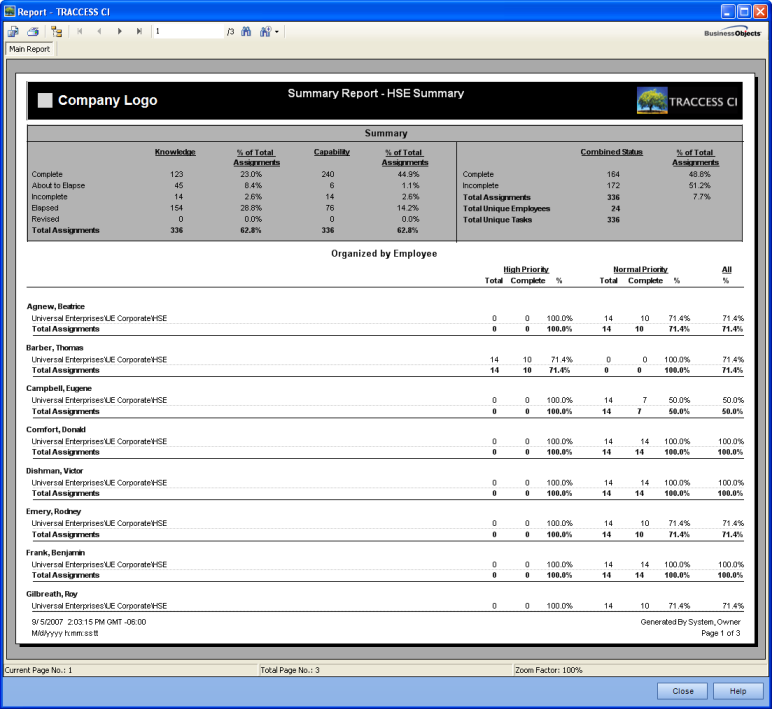
Once you have used the reports a few times, you may remember what the end result is supposed to look like, but cannot remember the report type name. Before describing the individual wizard pages, below is a sample generated report.
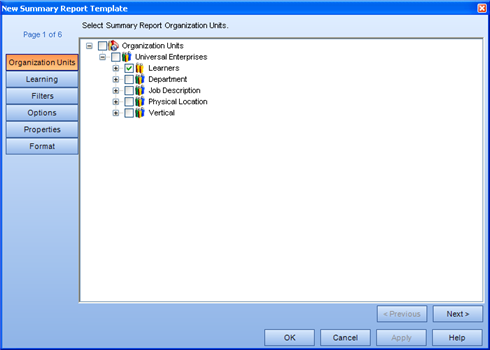
From this dialog, select the Organization Units, Learners heading and individual employees to report on.
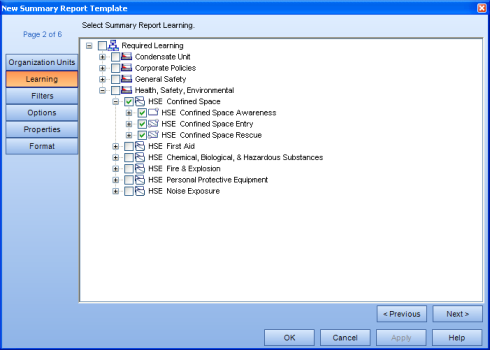
From this dialog, select the Process to report on.
Please Note: You do not have the option to select individual Sub Processes or Tasks in this report. This report is intended to be a look at the overall percentage of completion of an entire Process, and is not broken down by Task.
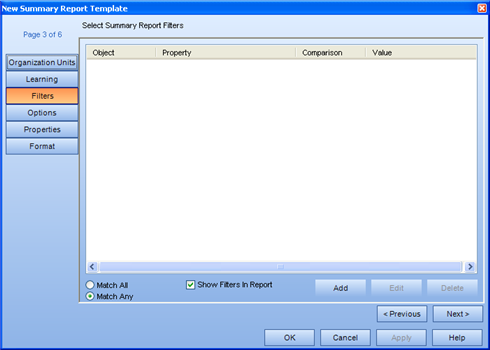
Create Filters with the use of the Add Report Filter dialog.
A Filter is a way of "weeding through" the information and only showing exactly what you are looking for. For example, if you wanted to start using certain functionality that you never made use of before, you may wish to see all Employees without an email address, so that you could enter it, and without a Primary Process, so that you could set it. This would narrow down your list to only show the ones that need to be worked on.
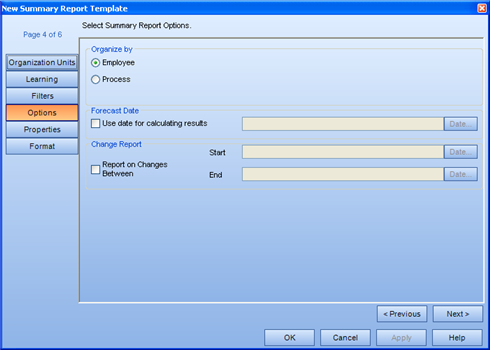
From this dialog, select how you wish to organize the report, and the dates you wish to report on.
Organize By - the choices here are Employee and Process. Unless you are reporting on a large number of Processes, it would likely be more useful to organize by Process. This way, the report selects the process and lists each person's completion on it. Otherwise, it will list each person, and their completion on the Process(es). The organize by Employee if reporting on a single process will likely double the size of your report.
Forecast Date - the primary use of this report is to examine Tasks with durations. Selecting a date in the future will calculate the state of the Task at that time. If there is no duration, a Complete, Incomplete or Revised Task will not change in state between the current date and a later date.
Change Report - the primary use of this report is to see what kinds of changes have occurred between two set times. For example, if you would like to see what kinds of statuses have changed during the previous month, this is the option to set.
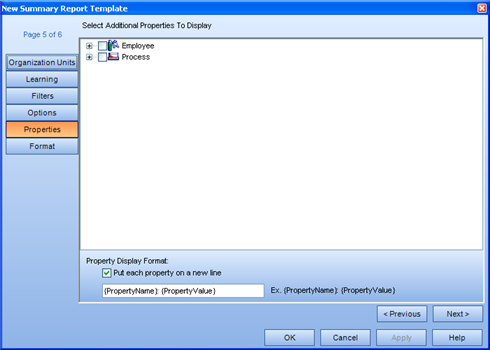
Select specific properties of the listed objects that you wish to add to the report. For more information on how report properties are displayed and used, click here.
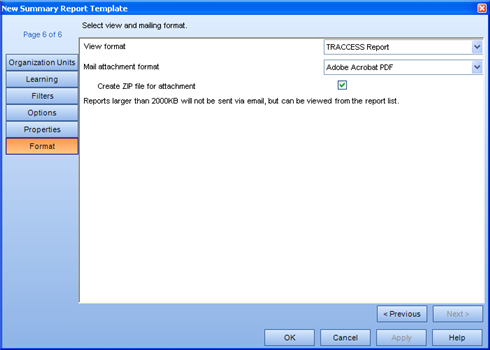
This page allows you to select two report formats: a view format and a mail attachment format.
View format - this is how the report will be displayed within TRACCESS. For this report, the view formats are: TRACCESS Report, Microsoft Excel, Microsoft Excel Data Only, Adobe Acrobat PDF and Microsoft Word Document.
Mail attachment format - this is the format that will be sent to your Inbox after the report has finished generating. For the Qualification Pie Chart report, the mail attachment formats are: TRACCESS Report, Microsoft Excel, Microsoft Excel Data Only, Adobe Acrobat PDF and Microsoft Word Document.
Depending on what you wish to do with the report afterwards, you will want to select different mail attachment formats. If you wish to manipulate the data, choose Microsoft Excel. If you wish to keep the report as-is, select the Adobe Acrobat PDF format.
Create zip file for the attachment - This will decrease the overall file size allowing you to generate and receive larger reports. However, you may wish to check whether or not attachments with a *.zip extension are currently being blocked by your email system before checking this option.
If the generated report is larger than the value shown in this dialog, you will receive a message indicating the completion status of the report, and that it was unable to include the attachment due to its size. In this case, you can still view the report within TRACCESS, and subsequently export it.
If the mail attachment format and the create zip file fields are disabled, this means that the option to attach generated reports to completion emails has been disabled for your installation.