|
|
|
|
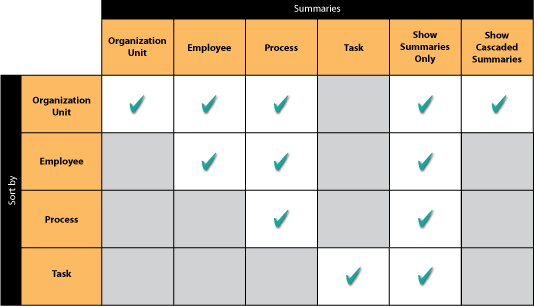
Depending on the selections you have made in the Options page when creating the Report template, you may see up to 4 summaries within the Qualification Report. These summaries will vary depending on how you have chosen to organize the report.

The beginning of each report will start with a Report Totals Summary. This always appears on a grey background. As shown in the legend section of the Qualification Report, there can also be three other summaries (each with their own colored background).
![]()
The Report Totals Summary should always appear - regardless of any selected settings in the template wizard.
This summary may be displayed when the report is organized by Organization Unit, Employee, and Process.
![]()
This summary may be displayed when the report is organized by Organization Unit and Employee.
![]()
This summary may be displayed when the report is organized by Organization Unit only.
![]()
For all of the summaries in the qualification report, the calculations of the values are the same. Using the Employee Summary from above, the following shows how all of the values are calculated.
![]()
In the far right side of the summary, there are three values: Tasks Complete (4), Tasks Incomplete (2) and Complete% (66.7%).
Tasks Incomplete (2) + Tasks Complete (4) = Total Tasks (6)
Tasks Complete (4) / Total Tasks (6) = Complete% (66.7)
On the left side, there are three columns: Total Credits (4/10), Total Credit Hours (31.5/79.5) and Total Learn Task Hours (31.5/79.5). To understand these values, we must look at the detail section along with the summary section.

|
|
|
|