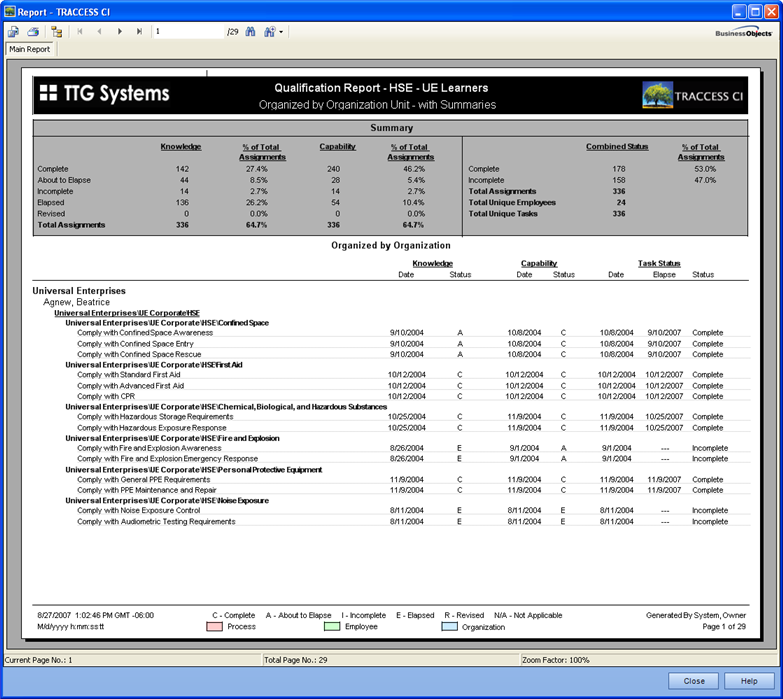
Once you have used the reports a few times, you may remember what the end result is supposed to look like, but cannot remember the report type name. Before describing the individual wizard pages, below is a sample generated report.

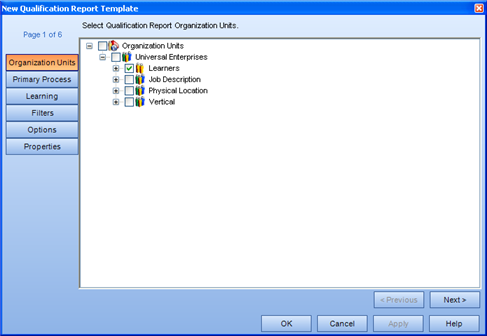
Selecting to report on an object that contains descendants will report on the descendants also. For example, selecting to report on Organization Units will report on all the Learners within the Organization Unit. Selecting to report on Employees only will report on the individual Employees.
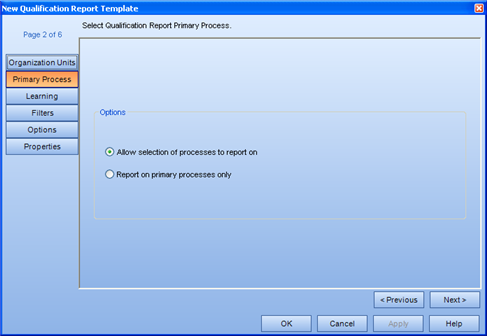
By default, the Allow selection of processes to report on is selected, which takes you to the Learning page top select your Process Sets, Processes, Sub Processes and Tasks to report on.
You can choose to report on each person's Primary Process. Selecting this option will skip the Learning page and go directly to the Options for the selected Employees.
If you are not familiar with the Primary Process property for an Employee, click here.
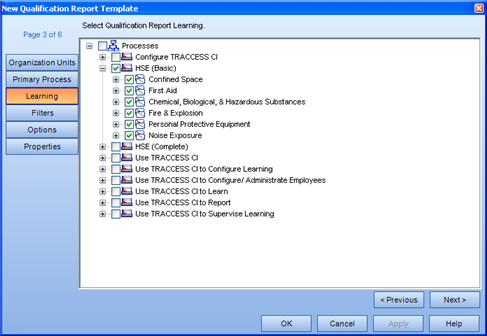
Selecting to report on an object that contains descendants will report on the descendants also. For example, selecting to report on Process Sets will report on all the Processes, Sub Processes and Tasks within the Process Set. Selecting to report on Tasks only will report on the individual tasks.
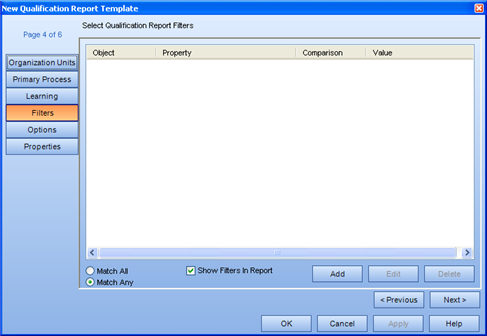
Create Filters with the use of the Add Report Filter dialog.
A Filter is a way of "weeding through" the information and only showing exactly what you are looking for. For example, if you wanted to start using certain functionality that you never made use of before, you may wish to see all Employees without an email address, so that you could enter it, and without a Primary Process, so that you could set it. This would narrow down your list to only show the ones that need to be worked on.
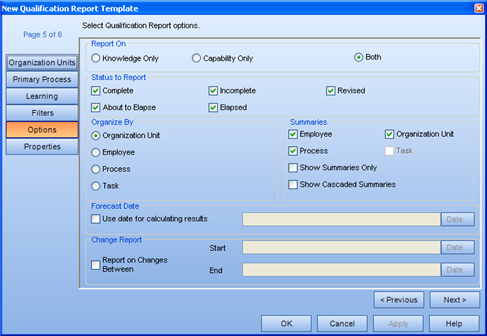
This page allows you to manipulate the results that you will see with the generated data. Rather than explaining every field on its own, the following are a few examples of how the options page can be set to produce specific reports:
Not changing any of the defaults - produces a report that has all statuses selected, organized by Organization Unit, with Summaries for the current date. This report will give an overall picture of how everyone selected is doing on all of the selected Tasks.
What training needs to be scheduled and when? - create a Forecast Date report
Ensure only the About to Elapse and Elapsed states are selected
Select the Forecast Date option, click the Date button, and select a date in the future
What this does is only include those Tasks that contain a duration. By selecting a date in the future, the results of the report are saying "If nothing changes between now and this date, what people's tasks will become either elapsed or about to elapse?". If your results show nothing by selecting, for example, one month in the future, then try completing the same report two months in the future. When you have enough people that are going to have their Tasks About to Elapse or Elapsed, schedule a course that will satisfy the Task requirements.
Who did what during the past week/ month? - create a Change report. If you are a supervisor/ administrator of a certain Organization Unit, and you want to enforce that people are logging into TRACCESS and completing some Tasks, you may ask that everyone complete "x" number of Knowledge/ Capability Assessments in the following month. At the end of the month:
Ensure that only the Complete status is selected
Select the Change Report option, and set the Start Date and End Date as the beginning and end of the previous month, respectively.
What this does is only include Tasks that were completed during this time. For those people who thought they had already done some Tasks beforehand and therefore did not have to follow instructions, their names will not appear on the report.
The owner of the company wants to know how everyone is doing, without all of the details.
Ensure that all statuses are selected
Select the Show Summaries Only option.
What this does is only show summaries for the people. It makes a much shorter report - but still breaks things down to some degree without getting to the point of a Summary Report (which summarizes % completion per person per process).
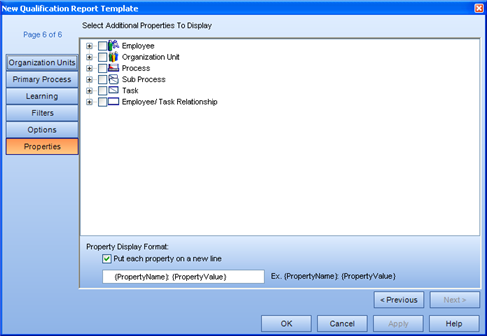
Select specific properties of the listed objects that you wish to add to the report. For more information on how report properties are displayed and used, click here.