|
|
|
|
The Qualification Summary may be displayed for Learners on the TRACCESS Dashboard, so they can immediately see a summary of their learning progression. (Supervisors can also view this chart by selecting a Learner in the Organization Manager then clicking on the Profile Tab in the main screen.)
You may add additional Qualification Summary charts to your Dashboard by selecting Home > Learner Chart from the Ribbon while viewing your Dashboard. This is useful when you want to view your learning progression on a portion of your learning. You may also see additional charts like this that your Operational Administrator or System Owner has added to your Dashboard using Dashboard Content.
Notes: You cannot remove a Qualification Summary chart from your Dashboard, unless you have added it yourself.
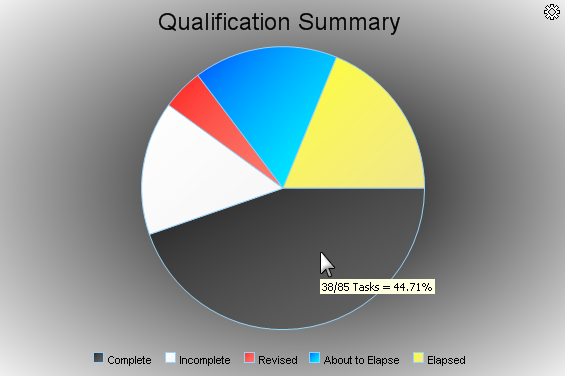
The Qualification Summary is a color-coded chart that displays a summary of all Task statuses:
Complete
Incomplete
Revised
About to Elapse
Elapse
The Incomplete and Elapsed statuses are especially helpful, since these do not appear in the Critical Tasks tree of the My Job Summary.
Each status is represented by its own color, indicated below the pie chart. If you do not see a particular status represented in the pie chart, then there are no Tasks that are currently in that status. Move your cursor over a portion of the chart to view the number of Tasks that correspond to the selected status, as well as the percentage in relation to the total amount of Tasks.
Additional Help: