|
|
|
|
Charts only appear on the Dashboard when the Charts feature is enabled. A System Owner can enable charts by selecting Tools > Dashboard Layout. The Dashboard Item "Charts" must be set to "Yes" under Show On Dashboard. For detailed information, visit Dashboard Layout.
Once charts have been enabled, data capture must be set up, as explained in the section below.
Note: Although Learner charts may show data without any data capturing, data warehouse must be enabled to show system averages when using the target lines.
Once charts are enabled, charts do not display information until data capturing is configured in the System Options. If no chart data is available, a message is displayed on the chart, indicating that the chart data is unavailable. A System Owner can set up chart data capturing.
To Set Up Chart Data Capture:
Select Tools > System Options > Data Warehouse.
Under the Chart Data Capture heading, select Enabled from the dropdown menu.
(Optional) Set a time when the data will be captured daily. The default time is 00:00:00 (midnight).
(Optional) Click the Update Chart Data Now button to capture data immediately.
Note: If the data warehouse Capture Interval is enabled and this data is newer than the data captured from the Chart Data Capture, the chart will use the most recent data capture. The Data Warehouse Capture can also be captured immediately by clicking on the Capture Now button. To gain a better understanding of data capturing, visit the Data Warehouse page.
Charts will also show data if only the Capture Interval setting under the Capture heading is turned on. Please note, however, that this data is retained, and it is up to the System Owner to delete it. Chart Data Capture deletes its data automatically with each capture.
In the Dashboard Layout dialog (Tools > Dashboard Layout), there are Chart Properties that affect how charts are viewed. These options are for global configuration.
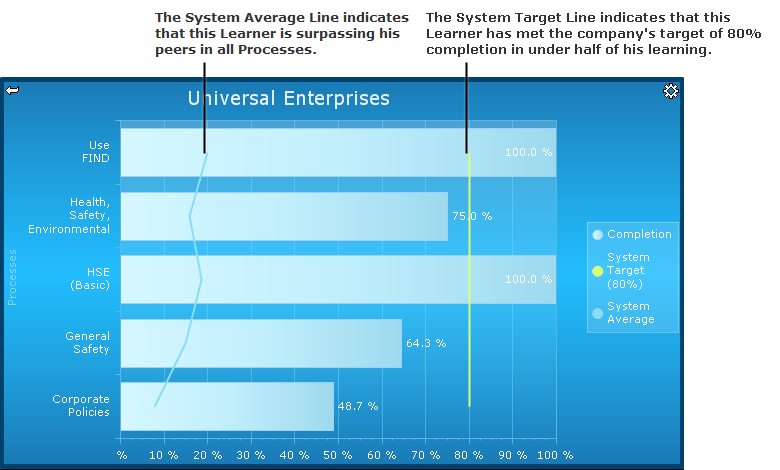
Enabled System Average in Charts allows Employees the option of viewing a system-wide average line. When turned on, this line will show the system-wide average completion of learning. This helps Employees compare their own data against the system average. For example, if a Learner is looking at her chart for completion of all her learning, she can compare her completion of each Process against the average completion of all Learners in the system.
Enable System Target in Charts gives Employees the option of viewing the system-wide display of the system target in charts. This allows Employees to compare a Learner's completion against the system target, thus encouraging Employees to pass this target.
Chart System Target is the suggested percentage complete for the learning in the entire system. The value is used for the "Target Achieved" variations of the charts to report on Employees above or below the system target value. Ideally a Learner's completion should be 100%, but as a system is introduced and to encourage usage, this number can be set at a realistic target value and increased monthly until the average system completion is at a desired level.
Below, you can see both the System Target along with the percentage and the System Average lines. And, you can see how these lines can then be compared to the actual completion.
click image to enlarge - double-click to resize
Once these lines are enabled globally, Employees can then enable them in their Chart Settings.
Custom Chart Skins allows you to add customized chart skins to the system. Contact PetroSkills about using this feature.
A number of default skins are available to change the color scheme of a chart. Custom skins can also be created and provided to you by PetroSkills to reflect your company's image.
Additional Help:
Adding a Chart to Your Dashboard