|
|
|
|
Charts used in TRACCESS are called "drilldown" charts. They differ from regular charts because they have depth and are interactive. Charts can contain several layers of information that can be "drilled into;" furthermore, you can select an item, such as a Process or an Employee and navigate from the chart to the main TRACCESS view, where the item will be highlighted for you.
Employees can add up to ten charts to their Dashboard, which are also customizable in style, color, and how the data is viewed. When charts are enabled, Learners see a default "My Job" chart, and Supervisors and Administrators see a "My Employees" chart. If an Employee has both a Learner and a management role, both charts are displayed. A System Owner sees no charts by default.
Charts must be enabled by the System Owner for them to appear on your Dashboard: Turning Charts On/Off.
Learner Benefits
Charts help Learners to keep track of their learning progression. It also makes it easier to find areas in their learning that they may need to work on.
Manager Benefits
Charts help managers to keep track of the learning progression of the Org Units they manage and to easily identify weak points or problem areas. For example, managers can identify Employees who are behind in their learning and find solutions.
Although charts can be configured in many different ways, the basics of understanding a chart are the same.
Drilldown charts do more than display information—they are interactive and can contain several layers of data, which can be clicked on to reveal the next layer of data. The first layer of data is known at the "root" and can be compared to the top layer of a hierarchial tree. All the layers are based on the hierarchy of Learning and/or of Employees in your TRACCESS system. Just as you can navigate down through different levels of a Learning or Employees tree, you can drill into different levels of a chart. The main difference, however, between a tree and a chart is that the chart is displaying overall completion information about the items in your system and showing you learning progression as of a certain date. Looking at the data on your charts allows you to identify items, such as Org Units or Processes that need attention, and you can easily navigate to that item in the TRACCESS system from the chart.
You interpret the chart's information based on the linear bars, bubbles, points, or lines (depending on the chart type) and percentages that represent completion. You may also see system average lines in your chart that help you compare data against other data in the system. Note that Learner charts show current state data (except when displaying system average lines); manager charts show previously calculated data.
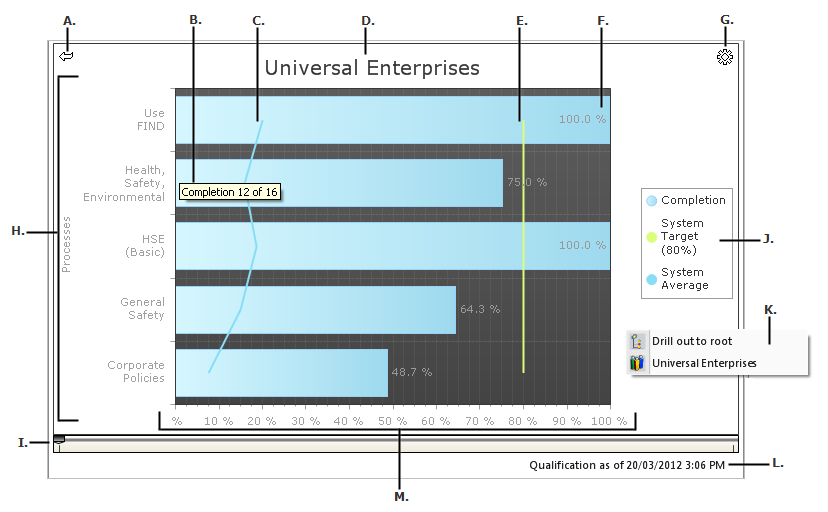
Below is an example of a Learner horizontal line chart. These basics of this chart can be applied to any chart.
click image to enlarge - double-click to resize
A. Drill Back Arrow - B. Tooltip - C. System Average Line - D. Chart Title - E. System Target Line - F. Chart Data - G. Gear Icon - H. Y-Axis - I. Track Bar - J. Legend - K. Right-Click Menu - L. Time/Date - M. X-Axis
A. Drill Back Arrow - Clicking on this arrow allows you to drill back one level at a time. If you do not see this arrow, you are viewing the root of the chart.
B. Tooltip - When you place your cursor over different parts of the chart, a tooltip appears displaying more information. For example, Process names are shortened when presented on the x or y-axis, but the tooltip shows the full name. Also, placing your cursor over a data bar displays completion such as "Completion 6 of 10." This indicates that six out of ten tasks have been completed for this Process. Completions of 0.0% do not show a tooltip.
C. System Average - The System Average line indicates the average Learner progression for the entire system. This allows the Learner to compare their own learning progression with the learning progression of the entire system. In this case, the Learner is well surpassing the system average, indicating they are doing well in their learning progression. (This line is initially enabled by the System Owner in the Dashboard Layout, and then it can be enabled by the owner in the chart Options.)
Note: The System Average line appears straight when viewing Task completion, Employee completion, and Org Unit completion. The line is not straight when viewing the average completion by Employees for each Process.
D. Chart Title - At the root, this will display the default or custom name of the chart. When you drill into the chart, the title displays what you are looking at, such as the Org Unit or Process name.
E. System Target - The System Target is a line indicating what the target percentage complete for the entire system is. In this case, it has been set to 80%, so you can see that the line falls at 80%, and just two of the Processes have surpassed this line. This indicates that the Learner is behind the system target. (This line is initially enabled by the System Owner in the Dashboard Layout, and then it can be enabled by the owner in the chart Options.)
F. Chart Data - The graph data is calculated through the y-axis and x-axis information. In this example, you can see that the General Safety Process is 64.3% complete.
G. Gear Icon - When clicked, the gear icon displays a menu with several options: Help, Drill Out Chart, Edit Settings, Export to Excel, and Print Chart.
H. Y-Axis - The y-axis is the vertical axis in the chart. In this example, we are looking at a horizontal chart, so the y-axis displays the variables for the chart, which are the Processes assigned to the Learner. The variables can, however, be many things, such as Org Units, child Org Units, Employees, Processes, or Tasks. These variables would be displayed on the x-axis if this were a vertical chart.
I. Track Bar - When there are too many items to display on the chart, a track bar appears, allowing you to scroll through the remaining data. Twenty items are displayed by default. This number can be changed in the Edit Chart Settings page. There is a 100 item limit.
J. Legend - The legend identifies by color different data presented on the chart. In this chart, the legend shows the Cascaded Completion, System Target, and System Average. The System Target and System Average will only show up in the legend if they have been enabled.
K. Right-Click Menu - When you right click on the chart, a menu appears, allowing you to drill back to different levels of the chart. If you right click on data, the "Jump To" option appears (in most cases).
L. Time/Date - The time and date shows when the data in the chart was last captured.
M. X-Axis - The x-axis is the horizontal axis in the chart. In this example, we are looking at a horizontal chart, so the x-axis displays percentages. These percentages could also be displayed on the y-axis if this were a vertical chart.
Learner charts show real-time data; the chart's completion data is calculated at the time the chart is displayed, and the average line data is taken from pre-calculated data. Manager charts retrieve data from pre-calculated data captured by the data warehouse or its chart data capture. It is the responsibility of a System Owner or Operational Administrator with permissions to set up chart data capture.
If your chart shows no data, this means that chart data capture has not been set up or that no data has been captured yet since the data set up. This can also occur if the selections results in no data, for example, drilling into an Org Unit with no assigned learning or assigned Employees.
Default charts are always displayed as a horizontal-style bar chart with a preset color scheme. You can customize the style of your chart in the Edit Chart Settings. There are three main chart style options:
Skin - A chart's skin is the chart's color scheme. TRACCESS provides multiple skins to choose from, such as dynamic, bright colors to subtle, light colors. Custom skins can be added to the system as well; these must be created for you by Petroskills.
Type - There are four types of chart types: bar, bubble, line, and point. Each type displays the chart data in a different style. One type may be easier for you to interpret than another. You can see an example of each type of chart below.
Orientation - The chart data can be displayed horizontally or vertically. The data shown on the y-axis and x-axis changes when each of these orientations are changed.
You can also change how data is displayed with the View By dropdown menu.
The layout and sizing of your charts is dependent on the layout of the panels on your TRACCESS dashboard. As a chart panel is resized, the chart stretches with it. The minimum size is 350 x 200 pixels. Visit Changing Your Dashboard Layout to learn about how to change the dashboard panels.
Additional Help:
Adding a Chart to Your Dashboard
Enabling and Configuring Charts