Using a TRACCESS Dashboard Chart
Dashboard charts are customizable, interactive, and flexible. Whether you have a Learner or a management role, your charts work similarly with the same functions and features.
Drilling in/Out of a Chart
Jumping to an Item from a Chart
Editing a Chart's Settings
Exporting a Chart to Excel
Printing a Chart
Deleting a Chart
Drilling In/Out of a Chart
Charts have depth and are made up of "levels" of information; the drilldown feature allows you to view these levels. A chart presents its information in the same order it does in the hierarchial trees. Just as you would navigate down through different hierarchial levels of a tree, you drill into the hierarchial levels of your chart. The information you initially see on a chart depends on what information has been set as the root level.
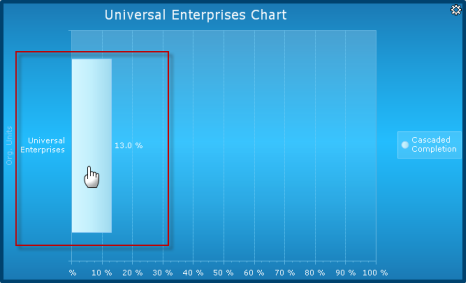
Below you can see a Supervisor's chart for the Universal Enterprises Org Unit that is cascaded by "Organization Unit, Process." As this chart is drilled into from its root (the Universal Enterprises Org Unit), you can see different data as this chart is drilled into.
To drill into a chart, simply click on the name of a Org Unit, Process, or Employee or directly on the data in the chart. You can see in the images below how this chart is drilled into.
|
The Root Level displays the overall competency for the entire company, Universal Enterprises. Clicking on the bar will "drill into" the information, showing the Organization Units that make up Universal Enterprises.
|

|
|
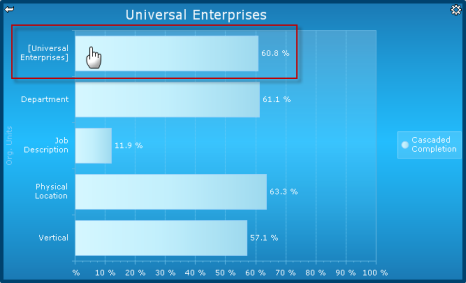
Within Universal Enterprises, there are several main Org Units.
|
|
|
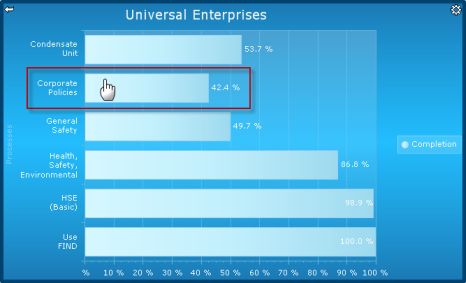
Once you drill into the Org Units, you can see the Completion level of each Process assigned to that Org Unit.
|
|
|
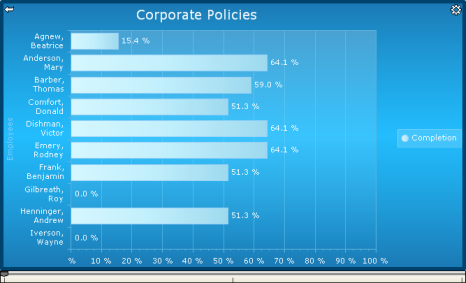
After you have drilled into a Process, you can see the progress of each Employee that belong to this Org Unit.
|
 |
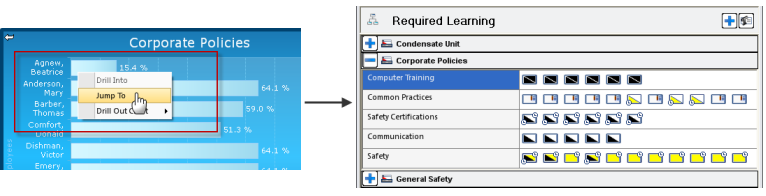
At any of these levels, you can right-click on an area, select Jump To from the menu, and this will take you to the main TRACCESS view with the item highlighted in the My Job tree, as explained in the next section. The Jump To function is available on most charts and on most levels.
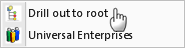
To drill out of a chart, click on the Drill Out arrow  to drill out one level. This arrow is located in the upper left-hand corner of a chart.
You can also right click on the chart and choose which level you'd like to drill out to:
Jumping to an Item from a Chart
Information in your charts is connected to the Learning and Employees in your system. Charts allow you to navigate to items in TRACCESS directly from a chart.
When drilling in and out of different items in a chart, you can "jump to" an item at any time by right-clicking on the item and selecting Jump To from the menu. This will take you to the main TRACCESS view with the item highlighted in the appropriate tree and/or the context view.
Supervisor View
Below you can see after jumping from an Employee's name in a Process, you are taken to his/her Learning in TRACCESS Home:
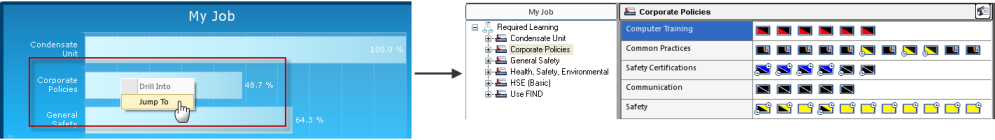
Learner View
When a Learner jumps from their My Job chart, for example, this particular learning is highlighted in TRACCESS Home:
Editing a Chart's Settings
Charts have many different settings that both Learners and managers can change including their orientation, type, style, and color.
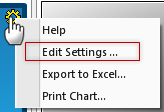
To edit a chart's settings, click on the Gear icon and select Edit Settings from the menu.
The Edit Chart Settings dialog, which is also used to create charts for your Dashboard, appears. You can change any of these settings at any time.
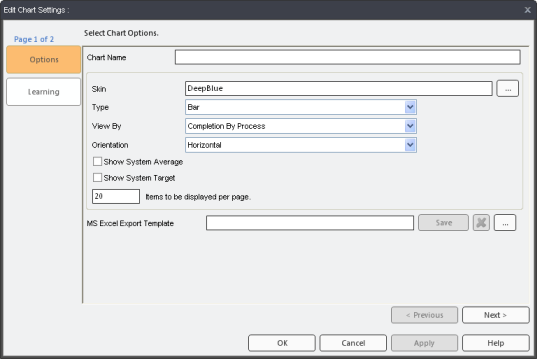
Chart Name - Type in a unique chart name. The name appears on the chart's tab on the TRACCESS Dashboard. It is recommended to use a unique name, especially if you plan to have more than one chart.
Skin - Click on the ellipsis button to view the available skins, and click on the skin you'd like to use.
Type - Choose a type of chart from the dropdown menu: Bar, Bubble, Line, or Point.
View by - Choose how to view your chart data—more info.
Orientation - Choose to display your chart data Horizontally or Vertically.
Show System Average - Displays the System Average line in your chart. This option is grayed-out if it has not been enabled by a System Owner in Dashboard Layout.
Show System Target - Displays the System Target line in your chart. This option is grayed-out if it has not been enabled by a System Owner in Dashboard Layout.
Items to be displayed per page - Sets how many items can be displayed per page. The maximum is 100. A track bar appears if all the items cannot fit on one page.
MS Excel Export Template - You can add a template to be used to export your chart to Excel.
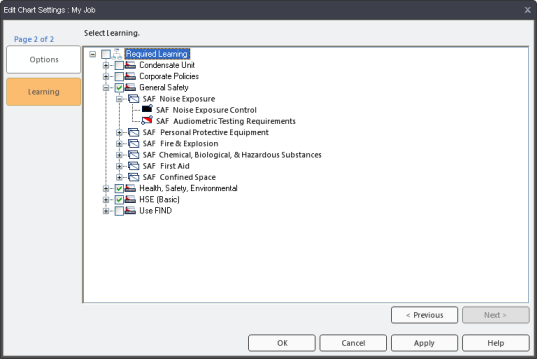
The next pages of the Edit Chart Settings dialog will differ depending on your role:
As a Learner, when you click on the Learning tab or click Next >, you can change what Learning appears on the chart from the Learning page. You can also change these settings at anytime. Click OK to save your settings.
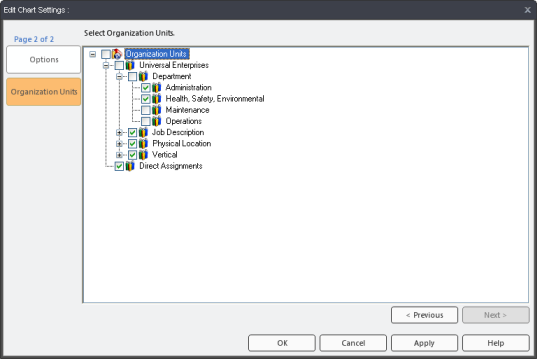
As a Supervisor, when you click on the Org Unit tab or the Next > button, you can change what Org Units you want to view in your chart.
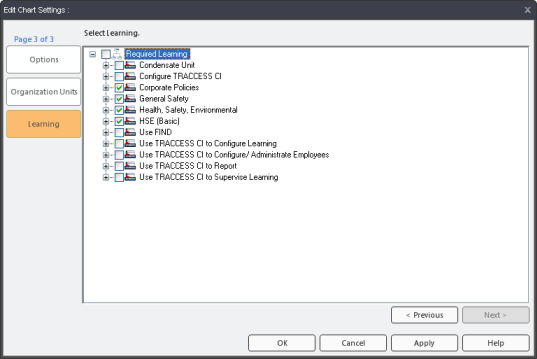
For certain View By options (charts that do not allow you to view Org Units), you will also see a Learning page, which will allows you to choose which Processes to view in your chart.
Exporting a Chart to Excel
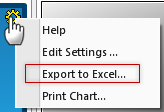
Exporting a chart to an Excel file allows you to save the chart as an external file, and then you can customize the chart, such as the look of your chart and use it to send a copy to your peers by email.
To export a chart to Excel, click the Gear icon and select Export to Excel from the right-click menu. The chart will then be displayed in Excel.
You can add a template to your chart settings; this allows you Export your chart to Excel with the same customizations each time; therefore, you don't need to continually edit your chart in Excel each time you export it.
Note: You must have Microsoft Excel installed on your computer; furthermore, different versions may display charts differently.
Printing a Chart
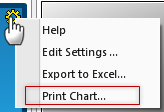
To print a chart, click on the Gear icon and select Print Chart. A dialog appears displaying printing options; these may differ depending on your Operating System.
Deleting a Chart
Once a chart is added to your Dashboard, it can only be modified or deleted. Take caution before deleting a chart.
To delete a chart, click the X on the chart's tab, or right-click on the tab and click Delete.
Additional Help:
About Charts
Adding a Chart to Your Dashboard
Enabling and Configuring Charts