|
|
|
|
Showing/Hiding Dashboard Items
Organizing the Dashboard Layout
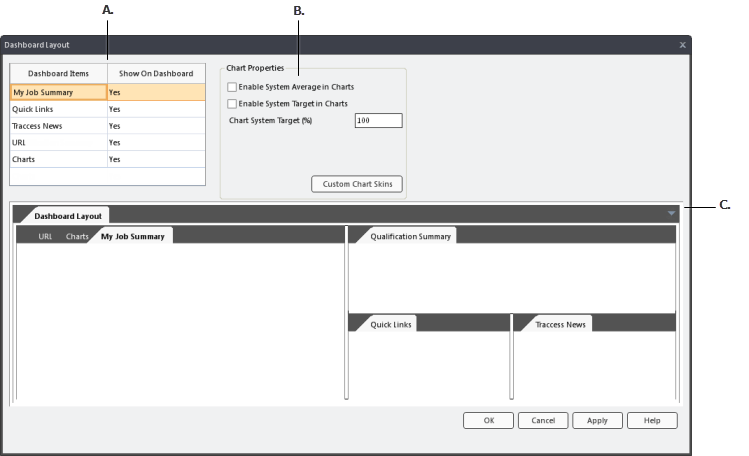
The Dashboard Layout dialog is used by System Owners, and Operational Administrators with permissions, to globally set which items appear on the TRACCESS Dashboard, to set the Dashboard chart properties, and to configure the Dashboard layout.
Note: The Qualification Summary is managed from Dashboard Content; however, "Charts" must be enabled in Dashboard Layout for the Qualification Summary to appear.
It is accessed by selecting Tools > Dashboard Layout.
click image to enlarge - double-click to resize
A. Dashboard Items / Show On Dashboard - Toggles what items to show on the TRACCESS Dashboard. These include My Job Summary, Quick Links, TRACCESS News, URL, and Charts. To learn more about these items, visit What is Displayed on the Dashboard?
B. Chart Properties - Options for the charts that are displayed on the TRACCESS Dashboard:
Enable System Average in Charts - Displays a line in a chart that represents the system-wide average completion of objects in the charts. This is to allows the chart owner to compare the displayed data against the system average. For example, if a Learner is charting their Process completion, the Learner can then compare his/her completion of that Process against the average completion of all the Learners in the system.
Enable System Target in Charts - Displays a line in a chart that represents your organization's system target. This allows Learners to complare their completion with the system target. If their completion is below the target, then they should try and spend more time completing tasks to reach or surpass the system target. The target is dependent on the number set in the Chart System Target (%) field.
Chart System Target (%) - This number represents your organization's system target. It is a way to show Employees where you expect them to be in their learning progression. This number defines the System Target line in charts.
Note: For these lines to appear, they must be enabled first by a System Owner in the Dashboard Layout. Once enabled, Learners and Supervisors can then enable these lines in their charts in the chart options.
Custom Chart Skins - This feature allows you to add customized chart skins to the system. Contact PetroSkills about using this feature.
C. Dashboard Layout - Allows you to globally configure the default layout of the TRACCESS Dashboard. Employees can customize the layout of their Dashboard to their own personal liking. Every time the layout is changed in the Dashboard Layout dialog, all Employees' layouts will be reset to the global layout. This layout is changed in the same way as Employees changing their personal layout.
Multiple different items can be shown on the TRACCESS Dashboard. Each time you enable/disable an item, it will appear in the Dashboard Layout.
Note: Charts won't show any data until Chart Data Capture is set up in the System Options. Quick Links, TRACCESS News, and URL is edited in Dashboard Content.
To enable or disable an item on the TRACCESS Dashboard:
Click on the box in the "Show On Dashboard" column beside the item you want to enable or disable.
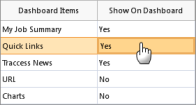
Click on the dropdown arrow, and then choose Yes to enable the item or No to disable the item.
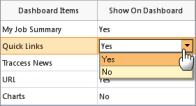
Click OK or Apply to save your changes.
Chart Properties has a few different options for Charts. When these options are enabled, Employees then have the option to turn them on/off in their own charts.
The Dashboard Layout dialog is organized through a drag and drop docking control. It works the same as it does for the TRACCESS Dashboard. Please see Changing Your Dashboard Layout for instructions.
Additional Help: