Add/Edit Supervisor Charts to Dashboard Content
To add or edit a Supervisor chart to Dashboard content:
-
Select Tools > Dashboard Content. A dialog box appears.
-
Click the Chart tab.
-
Click on an Org Unit name from the tree in the left pane, and click on the checkbox to enable the Chart(s) for this Org Unit.
-
Select a language from the Select Language to Edit dropdown menu, located in the right pane.
-
Click the Add  icon under Supervisor Charts. Click the Edit
  icon for editing an existing chart. The Edit Chart Settings dialog appears.
-
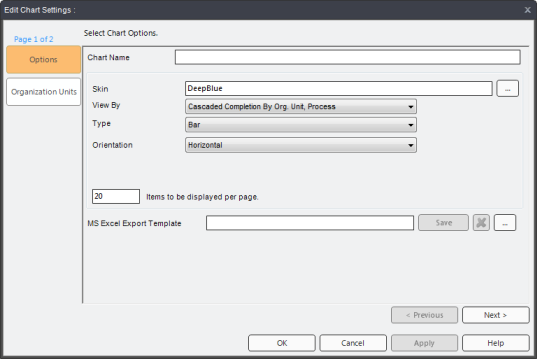
First, edit the Options for your chart—these can be changed at anytime.
Chart Name - Type in a unique chart name. The name appears on the chart's tab on the TRACCESS Dashboard. It is recommended to use a unique name, especially when adding similar charts.
Skin - Click on the ellipsis button to view the available skins, and click on the skin you'd like to use.
View by - Choose how to view your chart data—more info.
Type - Choose a type of chart: Bar, Bubble, Line, or Point.
Orientation - Choose to display your chart data Horizontally or Vertically.
Show System Average - Displays the System Average line in your chart. This option is not available if it has not been enabled by a System Owner in Dashboard Layout.
Show System Target - Displays the System Target line in your chart. This option is not available if it has not been enabled by a System Owner in Dashboard Layout.
Items to be displayed per page - Sets how many items can be displayed per page. The maximum is 100. A track bar appears if all the items cannot fit on one page.
MS Excel Export Template - You can add a template to be used to export your chart to Excel.
-
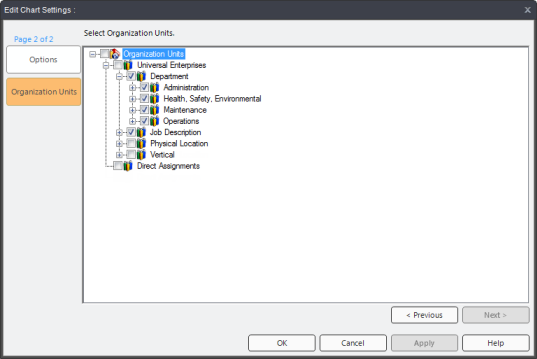
Click Next > button. The Organization Units page appears.
-
Expand the Organization Units tree and select the Org Units you want to display information about in the chart. You cannot select individual employees.
-
Click OK.
The chart is now listed under Supervisor Charts in Dashboad Content and will appear on Supervisor Dashboards.
Note: Charts will only appear on the TRACCESS Dashboard if they are set to appear. This is configured in the Dashboard Layout editor.
Additional help:
Dashboard Content: Detailed Overview
Adding Learner Charts to Dashboard Content
